Maximize your NVH measurement quality (using DIRAC)
31 January 2020
Current NVH measurement processes have been around since decades and do not leverage the possibilities that general advances in technology have to offer. There must be another way, right? In this article we look into regularly used measurements, the facets of those processes that could be improved, and the new way of maximizing your NVH measurement quality (using DIRAC).
How it’s done now
Typically, current measurement set-ups are described using Excel-style lists and hundreds of (detailed) photos serve as backup in case questions ever come up. With each measurement campaign a vast amount of data is generated. Some automated checks are performed (overloads, double pulses), but in the end it’s up to the test engineer to check all individual results. An impossible task.
Because the engineer can simply not check all the data, there are many unknown-unknowns after a measurement campaign: no-one knows if there are errors in the acquired data. This has two effects: 1) when discussing anomalies there is a debate around the measurement quality rather than the observations, and 2) measurement data is hardly re-used, because of a lack of trust in already acquired data.
A new way for test-based sound & vibration measuring
Every engineer should be able to do complex analyses ‘first time right’ in a fast, smart and simple way. Think of all the benefits of solving vibration problems before physical prototypes are built, instead of in the late and expensive phase of troubleshooting.
For that, VIBES develops intuitive and user-friendly applications (e.g. DIRAC) and provides training & consulting for performing high-accuracy, traceable measurements of the NVH characteristics of (car) components and subsystems. In order to obtain the best possible quality of your measurement, the VIBES approach includes checks on every level: Starting from the Measurement Preparation with DoF contribution insights, with Signal Checks, with classical FRF checks (passivity, coherence), all the way up to checks on the resulting Model using the Virtual Point Quality indicators on Reciprocity and Consistency.
Measurement Preparation
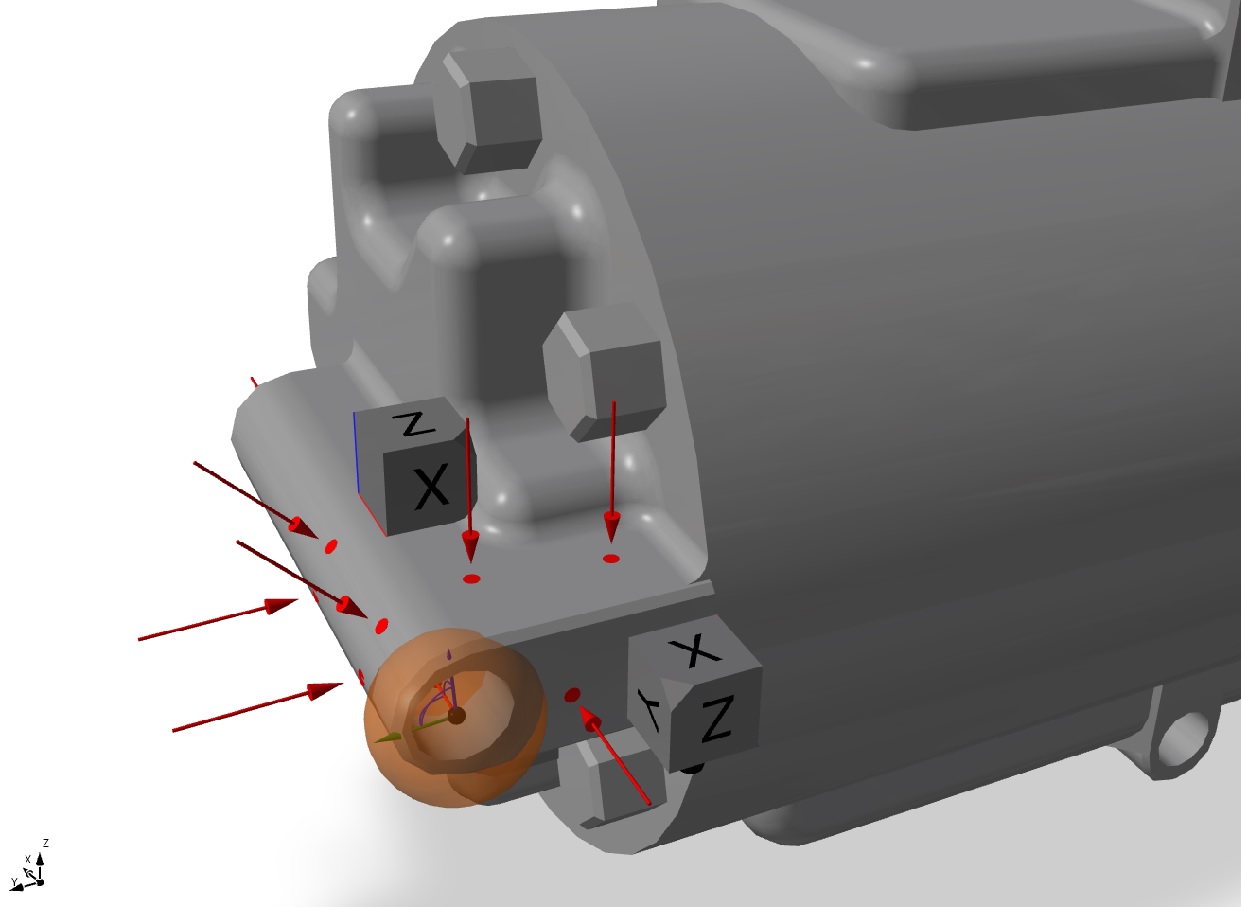
VIBES uses a 3D environment for the measurement preparation. The visual feedback with respect to sensor positioning eliminates errors directly. During the measurement, the engineer has visual guidance for sensor and impact-hammer locations. A common mistake, such as mixing up the order, is therefore almost eliminated. By adding photos to the measurement preparation, future discussions on the real-world positioning versus the preparation are eliminated.
Signal Checks
Basic signal processing checks ensure that the acquired data is on itself ‘correct’. By automatically checking things as overloads, double pulses, sensor measurement ranges and grounding DIRAC ensures that the pre-processed data is valid. Here we check individual data streams.
FRF Checks
When the time data is processed, there are some general truths in dynamics that have to be adhered. Repeated measurements should have proper coherence, for example. Energy can not be added to a system, therefore drive-points should have passivity. This allows to compare data streams which should be similar or should in itself have a certain behavior.
Virtual Point Quality indicators
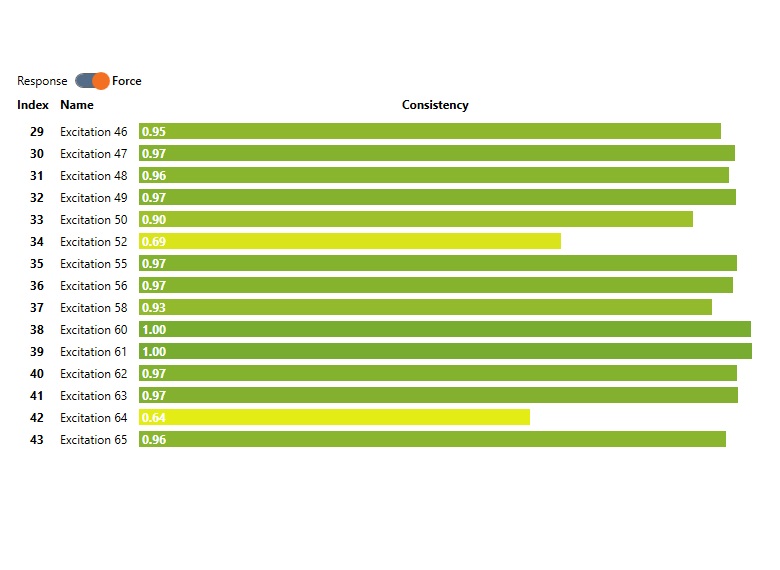
Still, errors as wrongly placed sensors can only be detected using more advanced checks. The Virtual Point Quality indicators integrated in DIRAC ensure this. The positioning information on all the sensors and impacts from the 3D environment is used to check the consistency within the full dataset that is acquired. Virtual Point motions can be expanded back onto measured signals, to check for channel-mismatches or positioning errors. By comparing virtual point transfer functions, true driving point behavior and reciprocity are checked. The only way to ensure the quality of the model as a whole is through these holistic Virtual Point Quality indicators.
Example case on measurement quality
In October-November 2019 we conducted a measurement with Magna Steyr on an E-Golf. As the project concerned a benchmark vehicle, CAD geometry was not available from design. Instead, 3D scanning was used to generate STL geometry files as the import for DIRAC. To generate high-quality component models in this project, we used our measurement software DIRAC. Thereby, all needed quality information was available live and any measurement errors could thus be identified and resolved right away.
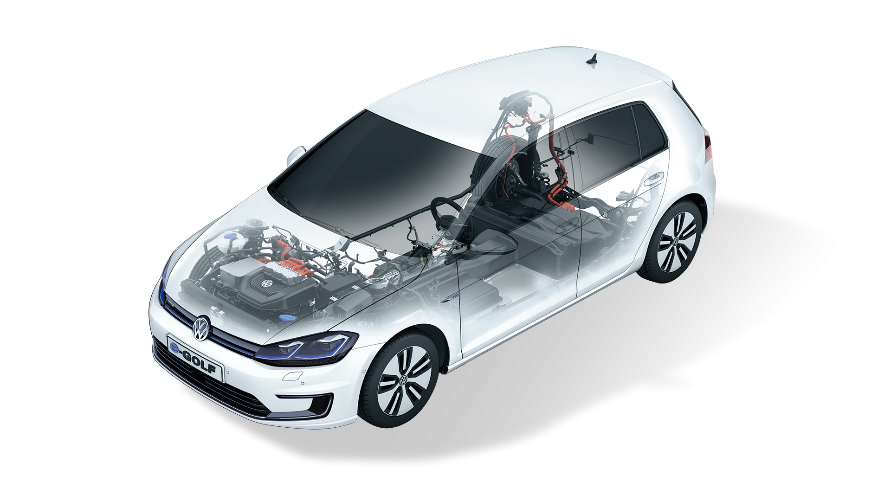
E-Golf with schematic display of the electric drive train with the E-Motor in the front.
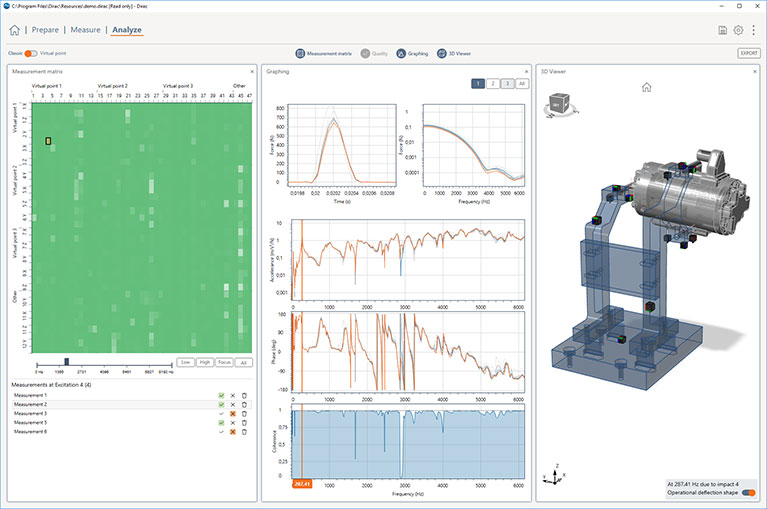
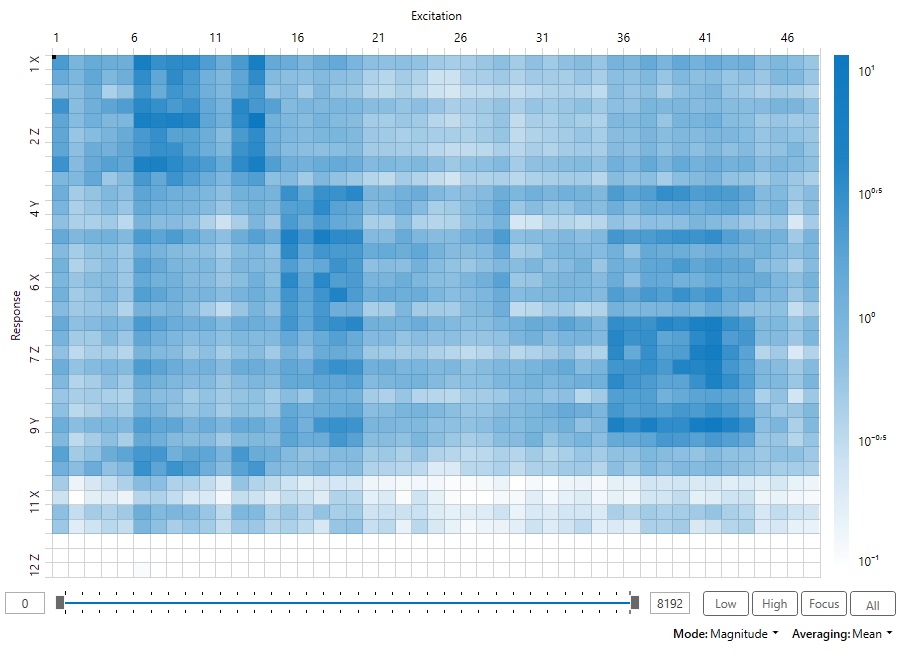
The E-Golf measurement in DIRAC. The matrix viewer shows the mean coherence in the frequency band of interest.

Result of substructuring of the test-based motor, rubber bushings and trimmed-body.
Read more about how our software and methodology have effected the quality of the measurement:
Maximize the quality of measurements
To answer the question how to obtain the best possible measurement quality: Build in checks on every level, preferably in a very early stage. DIRAC enables engineers to do this in a in a fast, smart and simple way. And have we mentioned already that DIRAC is an intuitive and user-friendly application?
More information
Do you want to know more about DIRAC and its guarantee for outstanding model quality? Don’t hesitate to contact us for questions or for the request for a free demo of DIRAC.