The Making of – SOURCE 2025 R1
13 November 2025
SOURCE 2025 R1, also known as SOURCE version 2.0, is about to see its public release. It is a complete reimagination of the product since its first introduction of version 1.0 in 2020, and the incremental versions following up until 1.9.
Many rounds of concept iteration, user feedback, product redesign and code refactoring have gotten into making this new product. The goal? Creating a true TPA and NVH analysis powerhouse that is versatile in the insights one can create, hyper-fast in calculating results and, above all, easy to work with without compromising on capabilities. In order words: creating an application that is ready to scale.
As product manager and one of the developers of SOURCE, I would like to take you through what has been a true journey of learnings, such that once you get your hands on it yourself, you will recognize the changes and feel welcomed in this brand new product!

SOURCE: The early days
The first version of SOURCE was developed around one main use case: calculating Blocked Forces using In-Situ characterization and applying them in a Component TPA fashion to simulate vibrations for new (virtual) assemblies. Released in the fall of 2020, SOURCE v1 was very much an anticipation to the uprise of Blocked Force Characterization in industrial processes seen at (automotive) OEMs and suppliers. Nowadays, this process has been standardized in the ISO 20270:2019.
The purpose of SOURCE was not to introduce a new technology by itself. In fact, with perseverance and the use of tools like the VIBES Toolbox for MATLAB, an experienced research engineer would be able to generate a blocked force dataset from an operational measurement and a carefully estimated FRF matrix (preferably, with Virtual Points though). Instead, SOURCE was aiming at a higher point on the ladder of Technology Readiness Level (TRL), so that any NVH engineer would be able to create high-quality results, easily and with confidence. This may sound complicated or unfamiliar, so let me quickly explain.
Making TPA look easy
TRL is an often-used measure for how mature a technology is, or in other words, how ready for use in real-life engineering work. Key to a high stage of TRL is that the technology is not only validated, but also made easy and accessible in use for a broad audience of professionals. This analogy is easily applied to software like SOURCE. As said before, scripting languages like MATLAB and Python allow a skilled academic to calculate a single blocked force result. With help of dedicated toolboxes, some streamlining and simplification can already be achieved. However, all of this is still reserved to those individuals comfortable with scripting engineering languages.
The mission of VIBES is to put innovative and meaningful NVH technology in the hands of product engineers that make our every days’ products quiet, comfortable and sustainable. We believe that those engineers shouldn’t need to hold a PhD in dynamics or acoustics. It is therefore needed to have high-level software that aims to simplify technology and processes as much as possible, so that time can be spent solving problems in product engineering, rather than debugging code in internal TPA tools. Simply put, software needs to become easy in order for its technology to make an impact in the world of engineering.

Over time, SOURCE added many features to simplify daily work, like linear editing of operational measurements, and quality checks like ODS visualization and operational consistency.
Balancing between ease of use and customizability
So, SOURCE could just become a strong jack-of-one-trade for Blocked Force TPA, interacting with various industry-standard file formats and driven by a step-by-step wizard… well, not really! Another reality appeared equally true. Whereas Blocked Force technology was somewhat of a new concept, the associated domain of TPA has been a vast field of engineering for decades. Best (and worst!) practices in signal processing, data visualization and variations on TPA methods have manifested in countless custom implementations, applied differently in every corner of the world. To mention a few:
- Time-domain conversion of force and TPA spectra, for the purpose of auralization
- Processing of order spectra an order cuts in frequency-based TPA calculation
- Visualization of Operational Deflection Shapes (ODS) in 3D
- Virtual Point technology
- Typical graphic layouts for partial contribution analysis
- Principal Component Analysis (PCA) for data reduction
- Complex Power to study vibrational energy propagation
- Real-time auralization with the aid of IIR-filters
- Countless matrix regularization methods and parameters to try and balance truncation versus overfitting
- VIBES very own X-DoF algorithm to remedy this last problem
Over the course of three years, we implemented all these capabilities in SOURCE versions 1.2 to 1.9, roughly in this order. Alongside, of course, many feature request brought forward by our users. This signifies an application that had grown organically with every feature. Although we were generally satisfied with how every feature was incorporated, we noticed that one could easily get lost in the myriad of options. Take for instance a look at the Settings panel of version 1.9: a large diversity of capabilities is found in a single list of checkboxes. At the same time, full customization of TPA analyses was not within reach, leaving NVH method developers still in the space of coded tools.

SOURCE 1.9: powerful and versatile, yet sometimes overly complex for standard analyses
Fluent TPA: a low-code paradigm for customization
In version 1.8, we introduced a new concept for customization: Fluent TPA. The idea was born from a deep understanding of TPA and its family of practical techniques (see this TPA framework paper and the VIBES.academy pages). In essence, every TPA method can be expressed as a sequence of matrix equations, that one could write down on a blackboard in a fairly concise way. For example, an in-situ blocked force characterization with on-board validation can be written in 3 equations, where every equation itself may represent a meaningful result. Underneath those equations are quite some essential assumptions, such as multiple-input-output (MiMo) behavior, frequency domain representation, and of course, the requirement that all degrees-of-freedom match up properly. One could say that this is a high-level, low-math way of governing the essence of a method. And once this essence is expressed in a sufficiently generic way, it opens doors to processing of various types of problems.

Fluent TPA to translate NVH processes from matrix equations to low-code TPA engineering in a step-by-step way
This high-level thinking led us to create an expressive software environment where one could write the essence of a new TPA method in a low-code manner. In Fluent TPA, every line is an instruction that starts with a short variable name, followed by a set of fully customizable operations that combines the results of previous instructions to create a new result. This result is either a meaningful NVH result of interest (e.g. an on-board TPA prediction), or an intermediate step towards something else (e.g. interface vibrations on the active side). The operations that one can choose from are either of “querying” nature, like selecting, splitting or combining datasets, or performing some arithmetic operation, like solving a matrix-inverse system of an FRF matrix with operational spectra, or converting from time to frequency domain. With these “low-code” tools, any TPA method can be easily expressed and customized to the preference of the user.
Evidently, Fluent TPA is a environment for the skilled research engineer. It needs some time to understand and master its capabilities. But the best part is that it seamlessly connects the freedom of low-code scripting with the efficiency of batch processing as found in SOURCE otherwise. Unlike a script in MATLAB, a script in Fluent TPA does not just process one dataset from A to Z, but can be applied to process any amount of datasets, of different natures, amounts of coupling points in one batch operation. More precisely: it completely separates the job of crafting high-value data analysis logic, from the work of selecting the right project data for processing and generating engineering insights.
With Fluent TPA first introduced in SOURCE v1.8, we directly liked the premise of providing tailored experiences for both the application engineering (high-TRL, high-volume processing) and the research engineer (low-TRL, low-volume processing), without compromising on any of them within the same product. We also decided we wanted to take the entire application a step further, as the product as set up from version 1 had now really grown out of its skin.
SOURCE 2025 R1: a one-stop TPA powerhouse
The redesigned SOURCE offers new levels of efficiency and creativity! The application optimizes your workflow, regardless whether you are generating tons of graphs for standard TPA analyses, or developing entire new analysis frameworks for your organization.

Most changes revolve around the Analyze module, but that is not all there is new in this version. Before diving into this new module, let me touch upon another notable change.
A new channel manager that understands your structure
As we have seen, users of SOURCE like to work with many channels. In NVH testing, full vehicle setups with 300 measurement channels are commonplace. In Component TPA scenarios in particular, one may want to measure Blocked Forces in a test rig setup, and apply those to other full vehicle test assemblies. This easily doubles the amount of channels. With such amounts, finding a good naming convention is already a challenge, that we happily leave in the responsibility of the engineering teams to decide on. One thing is recurringly seen though: channels names often reveal the topology of the structure, like “Rear Left Support Arm Active Inner +X”.
In the new SOURCE, we’ve made it much easier to organize channels, such that one can make good use of the topology of the structure itself. The redesigned channel manager is based on a tree list, allowing to create a hierarchy of channels, channel groups and Virtual Points, in a way that works for your project. Indeed, Virtual Points are now also logically managed in the same Channels card. Working with those is now very similar to how you manage Virtual Points in DIRAC. You can create them or import from a DIRAC file, choose which translational and rotational DoFs should participate, and assign measured channels to those VPs. In Analyze, those mappings are automatically picked up, allowing you to calculate responses and force degrees of freedom in the Virtual Points on-the-fly!

Examples of working with the new channel manager: easily mimic the topology of your structure and manage Virtual Points from within the same environment.
Using channels for various purposes
The new channel manager was essential to another feature in Analyze. An often heard limitation of SOURCE v1 was that a channel could only be used for one purpose, in all analyses. Say, you want to perform a multi-stage TPA on road vibrations, where you first calculate blocked forces at the wheel hub, and thereafter at the body points. In that case, assigning a single role to channels can be cumbersome, as an indicator channel for the one case could be a validation channel for the other.
In SOURCE v2, a channel type can still be set in the Channel Manager, but once in Analyze, one is free to create selections of channels for any purpose in the analysis. We believe that this does not only provide more flexibility, but also makes the user mindful of channel selections at time and place where they actually matter.
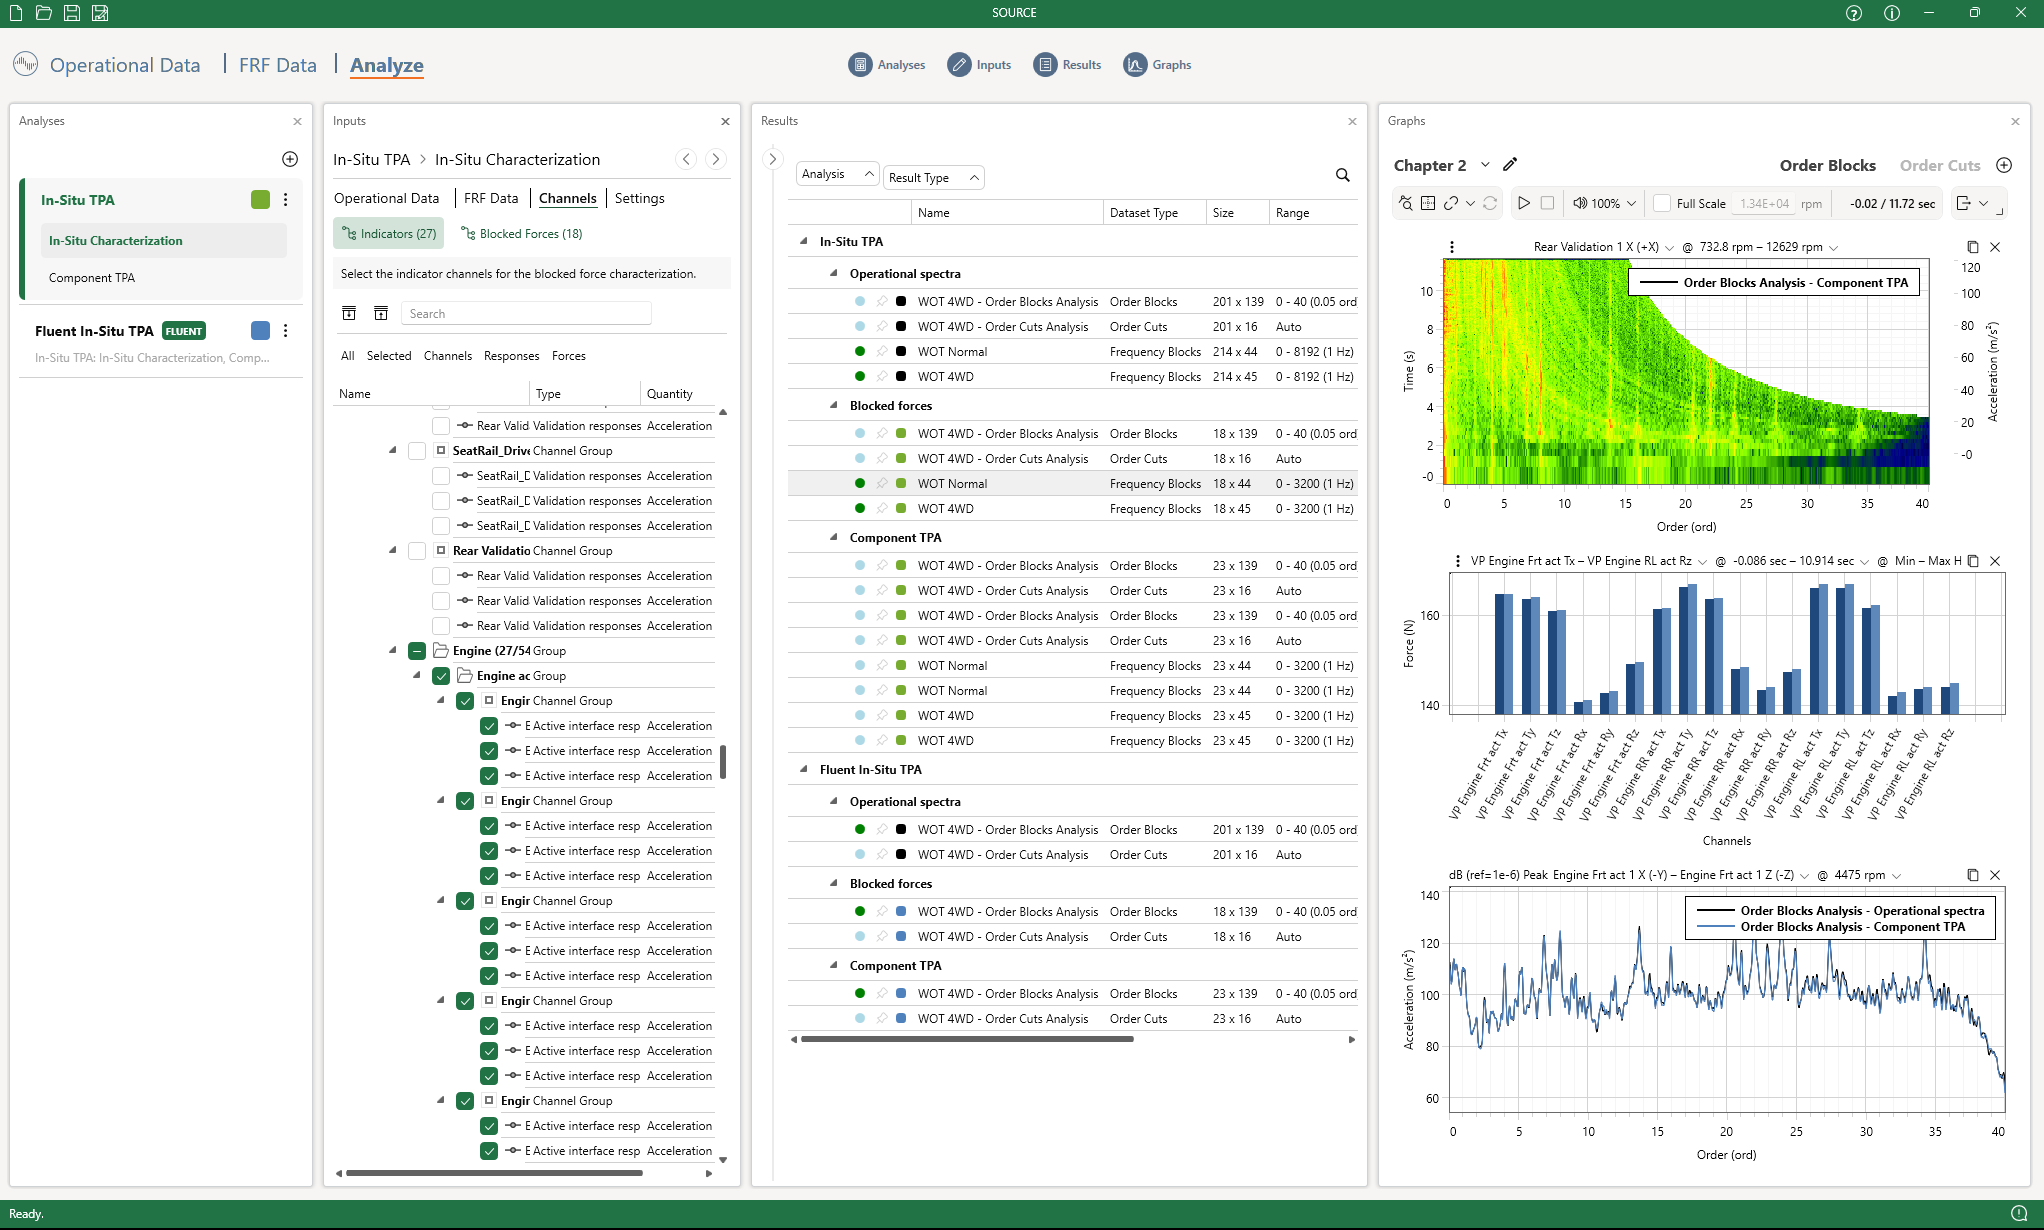
Analyze for fast, on-demand result calculations
Let’s now talk about Analyze. One of the truly unique aspects of VIBES software is the ability to work with data live. That means: be able to change every setting and observe changes instantly, without tedious rounds of in- and export of data. In earlier versions, this mechanism was already there, but not nearly as advanced and efficient as SOURCE has become now.
First of all, we got rid of the button to calculate results for an analysis. Why? Because results only need calculation once you ask for it. This can be for two reasons: to plot results in a graph, or to export result datasets to a file. Furthermore, we engineered an on-demand calculation engine that is extremely lean and specific. When arriving to the Results card at first, it shows you all the results that you can ask for. Those results are previewed, based on all choices you made in the Inputs card. Once a result is requested, say a Component TPA of a specific operational measurement, calculations will be started for those datasets that are used in the calculation, so the Blocked Forces, and in turn, operational spectra. It’s a pleasure to watch this happening in real-time, all in parallel. After a brief moment of loading from disk and calculation, those results become available for graphing, and can be efficiently reused.

The “Analyze” module, comprising four cards that can be opened and closed to optimize screen space and shift focus.
After creating a dashboard with various graphs, it is now time to study changes of settings, channels, or anything you have in mind. Any change made will get propagated to the affected results, allowing you to update the affected graphs instantly. We believe this truly unlocks insights and suggestions for product improvement that would otherwise have been left unexplored.
More to discover!
SOURCE 2025 R1 has many more new or updated features, like Order Processing from time data, Fluent TPA, a huge performance increase of X-DoF, streamlined Complex Power Analysis, improved time-domain auralization and more. In the months to come, we will share more insights on key features. But, we’re even more excited to see what you will do with all those, and which new NVH processes will be created in Fluent TPA with the full capabilities of SOURCE 2025 R1.
May the blocked force be with you!